Project brief

Bridge is a learning and development B2B SaaS platform that helps organizations train employees, track performance, and up-skill their workforce.
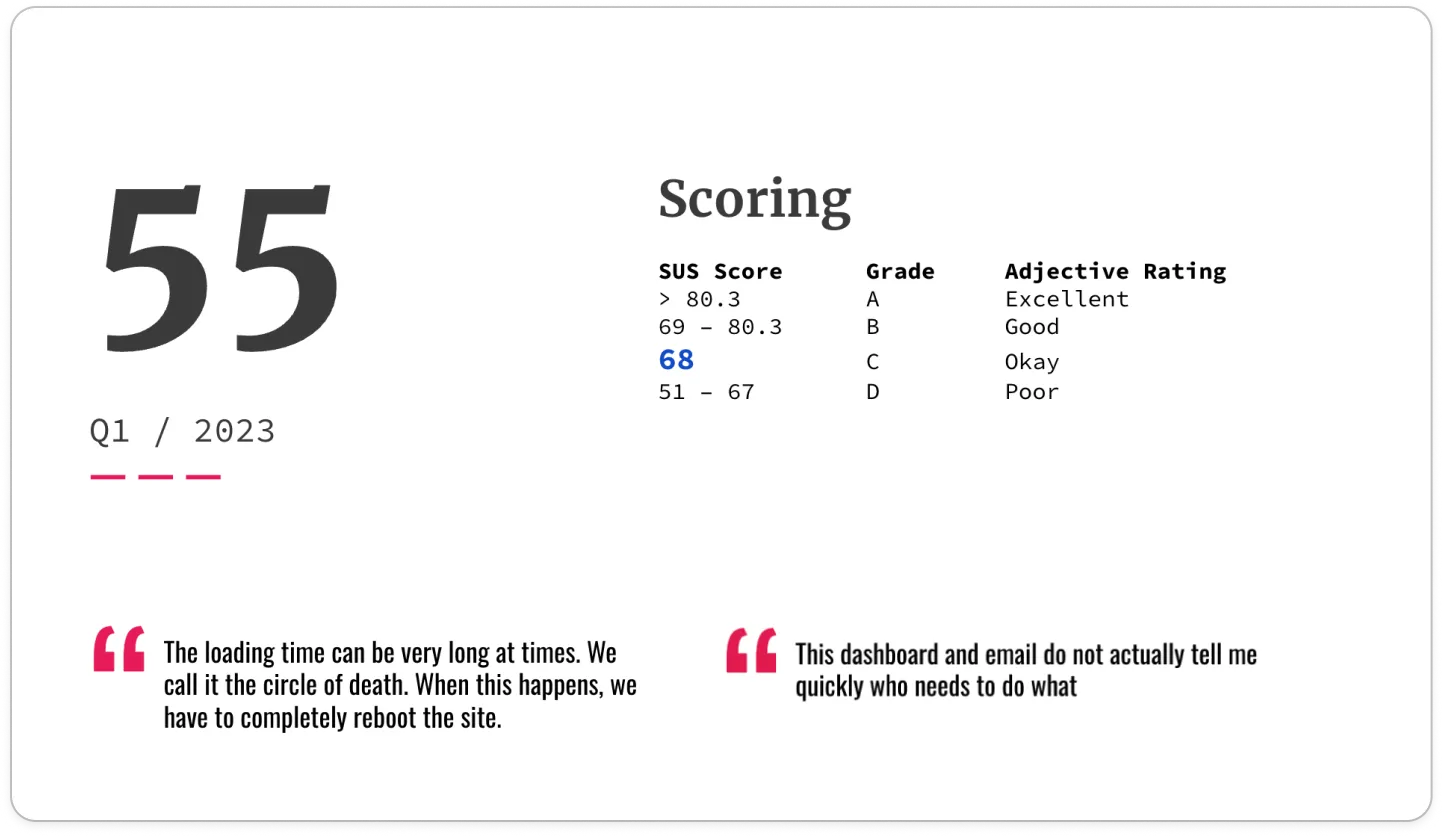
After being promoted to Director of UX and Design, I conducted a SUS (system usability scale) survey and our score went from 77 in 2022 to 55 in 2023. I realized we needed to begin rebuilding a culture of UX and design while considering product and business needs.
- Team5Designers
- Timeline6Months
- Engagement52%Increase
The purpose of this initiative was to build upon past success and increase our score back to the good range, with a stretch goal of getting it to excellent.
The riddle wrapped in a mystery inside an enigma
Our System Usability Scale (SUS) Score was ‘sus’ 🙃
Bridge had a big problem. Its foundations were built on good UX and design, but as the company went through several acquisitions it started to lose its soul by ignoring existing and emerging design and technological trends such as AI, microinteractions, and user research. The organization started confusing outputs for outcomes.
I presented this SUS score slide to the executive team and in a company all-hands meeting. It was a wake up call, to be sure. The question was, how might we get the score up, build excitement for UX improvements on the teams, and ultimately increase retention and sales numbers.
How might we?
Defining the project goals
Goal 1
Gauge whether the changes we implemented were moving us in a positive direction. The purpose of a SUS survey is to measure the perceived usability of a product. I wanted to baseline our score so that as improvements were made, I could determine if we were heading in the right direction.
Goal 2
Increase engagement and foster collaboration with the engineering and business teams to solve some glaring issues in the product.
Goal 3
Correlate UX and design improvements to business objectives and revenue. Basically, show the business that such improvements could affect the bottom line.
Introducing the Grab Bag
UX was often an afterthought in the product development process because of the incredible pressure put on by our parent company to integrate other acquisitions and engineer custom solutions. Experience, aesthetics, and delight were often deprioritized in the name of projects and features being completed. To combat this, I instituted what I called the UX Grab Bag.
“In order for this to work, you’ll need to speak the language of the engineers and the language of the business.”
— VP of Engineering
As I floated this idea around, the VP of Engineering made a comment to me that resonated deeply. As designers, we were not speaking the language of the engineers or the business.
Fluent in Design, Development, and Business Jargon
Design was feeling like the neglected red-headed stepchild, lost in translation because we’d forgotten how to converse in the dialects of our engineers and business counterparts. To shake things up, I led my team on a crash course in “JIRA-ese” and “ROI lingo.”
The first step was creating a JIRA project to document, in the language of engineers, what exactly needed to be done. Within each ticket we documented the UX need, a business use case (cost savings, revenue opportunity, etc.) and detailed notes of technical reviews that were held with the front end engineers.
I set up a JIRA backlog of UX tickets that our engineers could easily search, review, and pick up when doing their sprint planning or when they had discretionary down time. This was part of speaking their language.
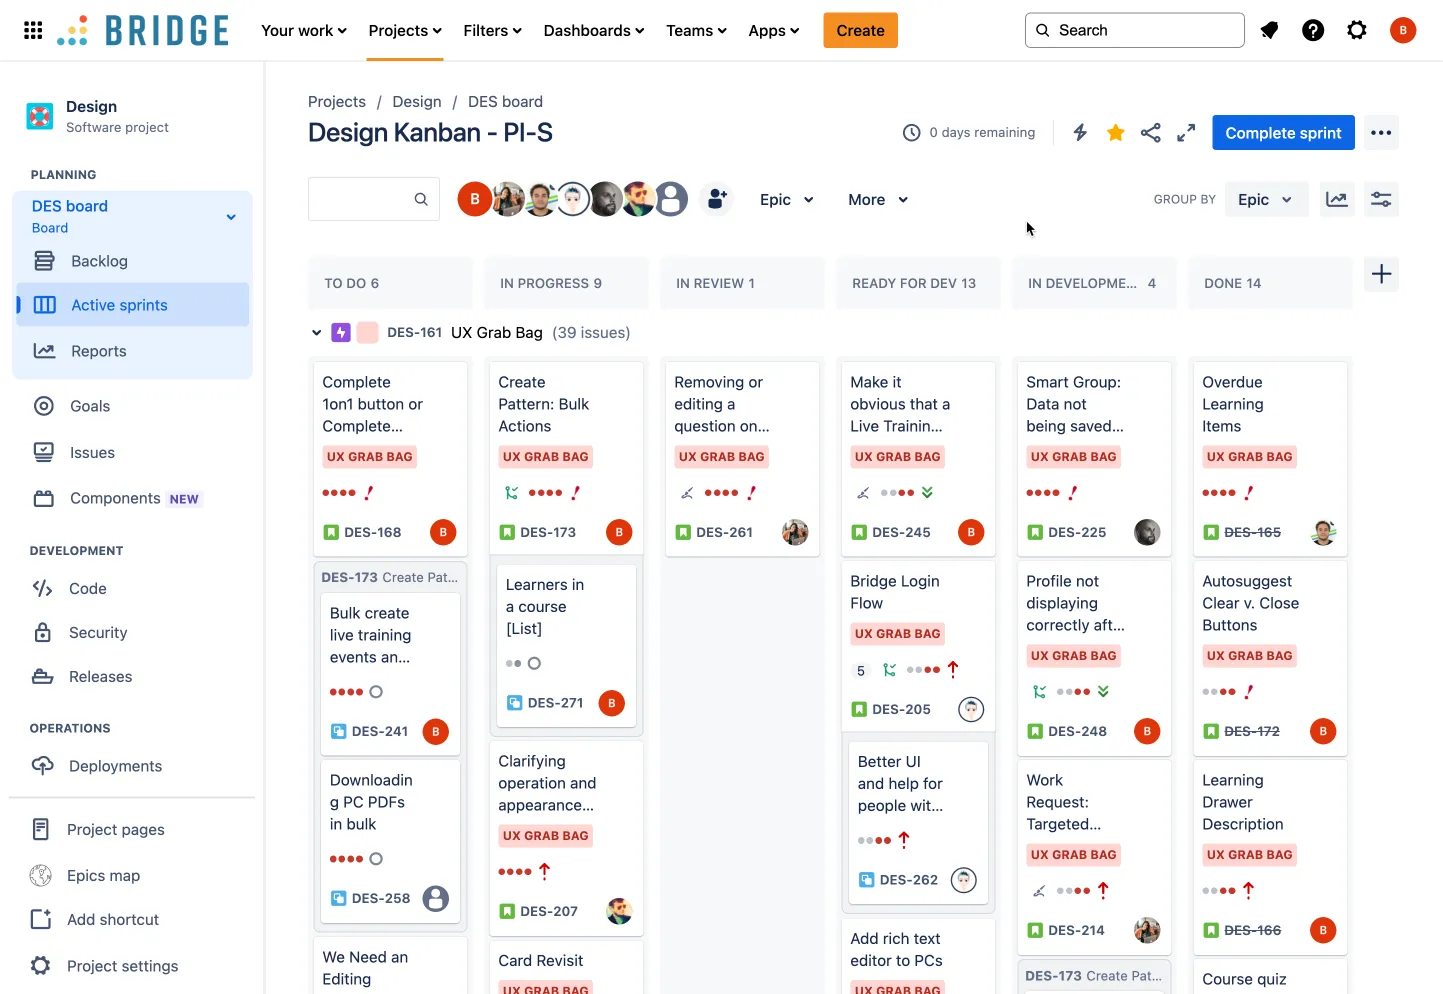
The UX backlog engineers could search, review and pull from during sprint planning or discretionary time.
No longer were we simply tossing designs into the Figma void and crossing our fingers to be heard or prioritized in the backlog. We were showing the bean counters the dollar signs and the tech wizards the bug-squashing, tech-excellence potential. Some might say it was like teaching a cat to bark, but hey — finding that harmony eventually paid off.
The Devil in the Details
The UX Grab Bag became our secret weapon, empowering engineers to don their superhero capes during those elusive pockets of discretionary time — be it the hour between meetings or a brief respite from the critical-path chaos.
But its magic didn’t stop there. It also served as a magnifying glass, revealing the multitude of UX potholes dotting our organization’s digital highway. Armed with usability studies, Fullstory sessions, and the echoing voices of our customers, we painted a vivid picture of the urgency to patch these holes.
And last but not least, the Grab Bag became our roadmap, guiding us through the labyrinth of technical feasibility reviews with our engineers and illuminating the path to tangible business outcomes — be it cost savings or revenue boosts. In essence, it was our toolkit for transforming UX woes into wins.
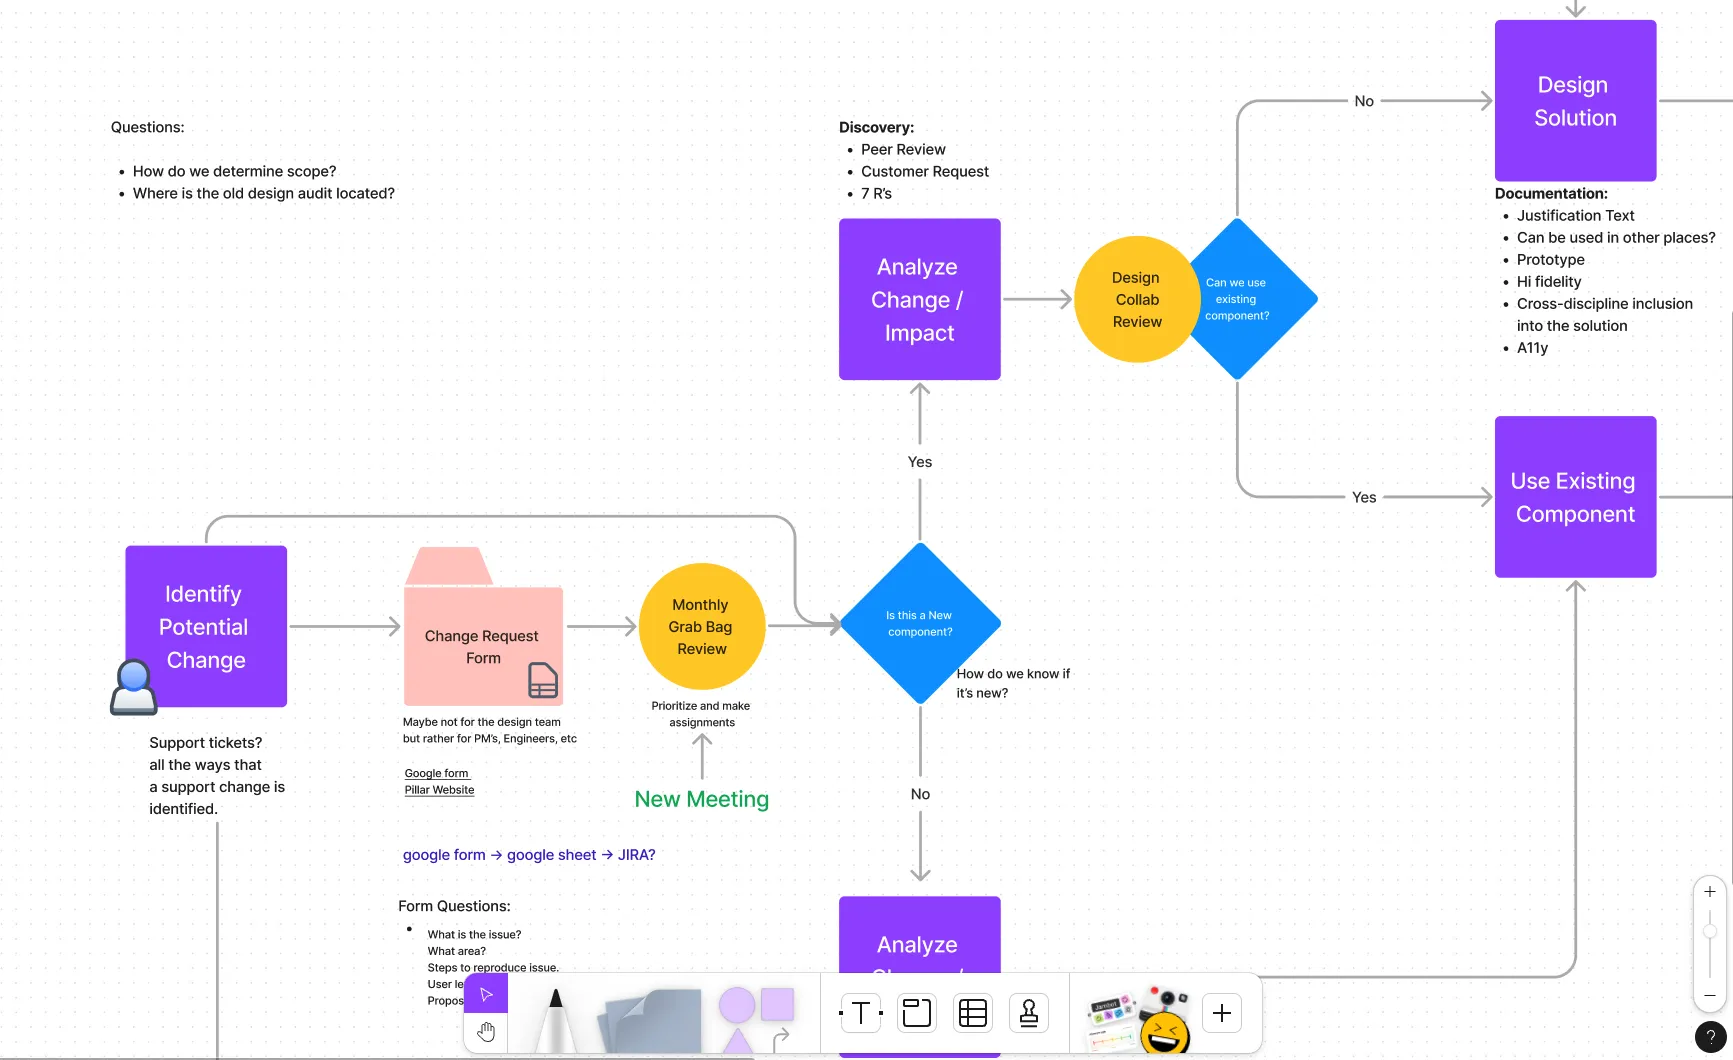
Our documented process to identify change, conduct technical reviews, and define business outcomes.
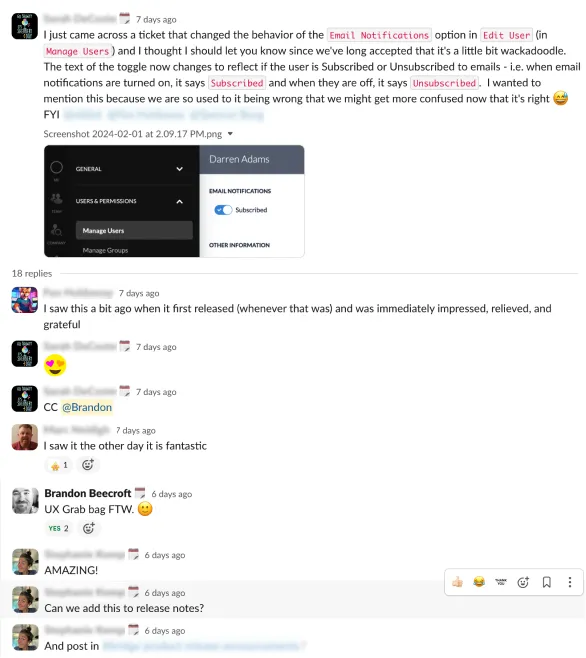
A Slack conversation about a UX Grab Bag ticket that had just shipped.
Outcomes
Achievements of the UX Grab Bag
Here’s the TL;DR snapshot:
- 52% increase in developer engagement quarter over quarter.
- Projected: 10% cost savings for our CSM team on 1 UX ticket alone.
- Goal: Increase retention rate by 25%.
- Goal: Increase System Usability Scale (SUS) score to 68.
I was laid off before I could confirm the retention and SUS goals — here’s what I do know, and what I’d have measured next.
Here’s the more in-depth version.
The UX Grab Bag initiative proved to be a resounding success. Designers within my team felt empowered and valued, their voices finally resonating throughout the organization. Engineers found a clear path to contribute to UX-related projects they were passionate about, streamlining their efforts and fostering a culture of collaboration.
Notably, we witnessed a remarkable 52% surge in development activity focused on addressing UX issues quarter over quarter — a testament to the initiative’s impact on prioritizing user experience within Bridge.
Alas, I was laid off from my position, as were many of my US-based colleagues, as the workforce moved to Eastern Europe and India. As such, I was unable to determine many of the outcomes of this initiative. 😔
If I had been allowed to complete the measurements, I would have compiled all tickets completed in the last sprint to measure the UX and business KPIs. As it were, I projected a 10% monthly cost savings for just 1 of the 94 UX tickets that would have affected our CSM team.
And finally, I was in the process of sending out another SUS survey to our customers. My expectation was that we would have increased our SUS score by 13 points.